The first round of finals games over the weekend provided three close finishes from the four games, a pretty good record for a season that would like to be forgotten by many fans.
As enjoyable as those games were, we wouldn’t want recency bias to hide the fact that the 2021 NRL regular season was underwhelming to say the least and had a significant number of outlier statistics.
And I’m not even talking about the standard ones, like Melbourne nearly breaking the consecutive win steak record and nearly scoring the most points in a season, Cody Walker trying Johnathan Thurston’s record for try assists in a season, or Reuben Garrick scoring more points himself than the Canterbury Bulldogs did as a team.
I’m also not going to talk about set restarts (seriously), other than to state that the cumulative effect of all rule changes in the past 18 months can be seen by the sheer number of outlier statistics from multiple teams this season.
It’s not unusual to see one (or maybe two) teams hit a high mark for one statistic in a season. For multiple teams to hit multiple records in a single season is a sign that something has shifted too far.
I’m not holding my breath for the proposed end of season review, which states that fans will be heavily involved. A simple change of removing set restarts for being offside and re-introducing a second referee would improve things, or removal of set restarts completely if we’re to remain with one referee. But I digress.
The statistics below are also evidence of just how embarrassingly one sided the regular season competition was this year, with one or two completely dominant teams, a handful more who were very good but unlikely to prevail, and a huge number of also rans. On to the perfectly normal outliers.
The increasing number of blowouts and amount of garbage time
Earlier in the season the Eye Test examined at the minute-by-minute margins of games, and it wasn’t a pretty picture.
The average half time margin was 11.4 points, with huge increases in minutes played with a margin of 19+ points. Looking at the end of season numbers aren’t much better, as you can see below.

Up until the 30th minute, the average margin is pretty consistent with prior seasons. The yellow line for 2021 diverges at about the 30th minute where the average margin is 8.4 points, then goes to 10.9 for half time, 12.9 by the 50th minute, 15.0 by the 60th minute, 17.3 by the 70th minute and 18.8 points by the final whistle.
The average NRL game this season had a margin in at the end of the game of more than three converted tries.
One of the points mentioned in the previous analysis of this data was that for a product that heavily relies on television revenue just to exist at this level, the increasing disparity between teams occurring even earlier in games is a huge cause for concern.
Round 16 was one of the worst outliers this season, where the minute-by-minute average margin beat out all other rounds since 2016.

From the 34th minute onwards, no other round in the past six seasons was close to the average margin of Round 16, 2021. It would have been even earlier but Round 10, 2010 had some large margins from the 25th-35th minute.
More alarmingly the percentage of garbage time (minutes with 19+ margin) increased by 43% this season from 12% to 18%.

Let that sink in for a minute. The share of time played this season with a result virtually assured increased by 43%. Again, not a great look for any upcoming broadcast deals. Interestingly though, the change didn’t come from minutes played where the score was tied, it was the same as 2020 (15.1%) but down on the high point of 2019.
Not only that, 10% of minutes were played with a margin at least six converted tries the difference in scores. Once again, let that sink in – at least eight minutes a game were played with a margin of 30 points or more.

When you put this number into context as a total it becomes even more stark just how one-sided regular season games were. Over 2,800 minutes were logged with a margin difference of at least 19 points.
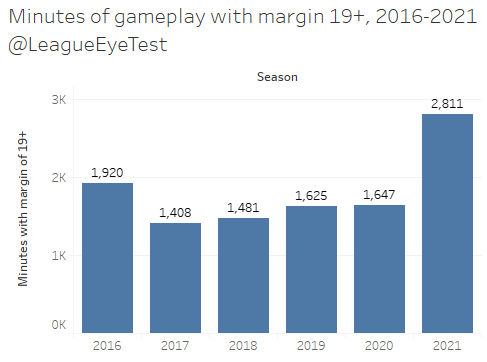
It’s easy to see the huge jump in total garbage time minutes from this chart, an increase of 68% on 2020. Those 2,811 minutes equate to over 35 full games played with a gap between teams of 19 points or more. Those 35 games make up over 18% of the NRL’s 192 game regular season schedule, nearly one in five games. Hide this one from any prospective media bidders.
All very normal stuff.
For and against outliers
Another example of the statistical outliers we saw this season is looking at average for and against by teams from the NRL era (1998 onwards), which was examined a few weeks ago The League Eye Test. Below is the end of season update.

Melbourne (and to an extent South Sydney) stand out as anomalies for the 2021 season, both scoring more than 32 points per game, a feat that had only been accomplished once previously (Parramatta, 2001). Melbourne have the best per game average in points scored, with Souths second since 1998.
Manly, despite a horrid start to the season still hold the fifth-best per game average for points scored. However, if you look at just games from Round six, they’re actually ahead of Melbourne, with the three highest per game scoring averages in NRL era history coming this season.

Perfectly normal stuff, I know.
The other outlier we can pick from this data is by looking at the same data but colour coding them based on making the top eight or not.

Newcastle stand out as well here, as one of just four teams to make the finals with a below average attack and defense, although one of those teams (Canberra 2002) were only admitted due to the Bulldogs salary cap breach.
It also shows that Newcastle had one of the worst attacks of a team to make the top eight since 1998, scoring 17.8 points per game which only puts them ahead of the 2007 South Sydney team that scored 17 points per game.
And the Knights were comfortably seventh. The fact they gave the Eels a scare on Sunday probably says a lot about the Eels chances going forward.
Margin versus running metres
Another outlier this season was just how dominant Melbourne and Penrith were, beating teams by 20.7 and 16.3 points per game respectively. Those numbers were the two highest average margins of victory in the NRL since 2014, beating the previous best of 14.95 by Ivan Cleary’s Panthers in 2020.

What is surprising is that both sides achieved this without having the best season for average run metres gained in a season. The Panthers and Eels of 2020 gained more metres than Penrith or Melbourne this season.
On the other end of the scale, Canterbury’s Trent Barrett had one of the worst seasons since 2014 for not only margin, (-15.4 per game), but also run metres. The Bulldogs averaged nearly 300 metres fewer per game than the Panthers and 200 fewer than the Storm. It puts them in an illustrious group of teams, including the 2020 Anthony Seibold Broncos and the 2016 Nathan Brown coached Knights for futility.

It looks even worse for Barrett when you look at the last three seasons of net post contact metres (post contact metres gained minus post contact metres conceded). The Dogs won just two post contact metre battles all season, which you can see on the below chart.

They gave up 166 more post contact metres per game than their opponents, by far the worst mark in the NRL in the past three seasons. Even the wretched 2020 Broncos coached by Seibold only gave up 20 more than their opponents.
Very normal indeed.
Dominance of field position
Not only were the top teams scoring more points and winning by record margins, but they were also restricting opponents field positions. This year there were four teams who held their opponents to more than 60% of play the balls in their own half, a feat that only occurred once since 2014 (the Panthers in 2020).

There was nearly a 5th team, with teams facing Newcastle playing the ball 59.9% of the time in their own half.
Very normal, I know.
The Tom Trbojevic dominance
Say what you will about his disappearance on field in Friday’s loss to Melbourne, but Manly’s Tom Trbojevic had one of the best regular seasons statistically in NRL history. Some of that is due to stat inflation due to more time in play, but it doesn’t downplay just how he carved through the competition.
If you look at the Eye Test’s Net Points Responsible For statistic from 2014 onwards, not only does Trbojevic have the best season on record, but two other players from 2021 sit inside the best five seasons for NPRF ever.

Just behind Turbo at +13.1 points per game is Nathan Cleary, whose +12.4 would have shattered his own prior best in 2020 if not for the Manly #1. Cody Walker (+9.3) takes fifth spot all-time for his impressive season as well.
A number of other players from 2021 sit inside the top 20, with Jahrome Hughes, Brett Morris, Mitchell Moses and Daly Cherry-Evans having comparable seasons with Johnathan Thurston and Cooper Cronk for NPRF. Jarome Luai and Adam Reynolds also sat just outside the top 20.
Totally normal stuff from a very normal season, your 2021 NRL season.