


After 10 rounds of the 2019 season I embarked on a wildly ambitious endeavour; to predict the results of every remaining match of the 2019 Season using a formula that weighed the current standings along with factors including home field, form and more.
Regardless of the result I promised to publish the results and for those of you who kindly took the time to read my article back on the 24/5/19, I had to follow through and review how my weekly predictions, projected ladder and projected Grand Finalists turn out. Here are the results of this crazy endeavour.
Results
Below is the spreadsheet I used to predict the results (top half) and the actual results (bottom half). Green cells mean correct predictions and as the season went along the green becomes far more prevalent. Interestingly, it was a rough start with an under .500 success rate until round 14. From there on though it was much smoother sailing with a 69.51% success rate from round 15 through the end of the season. All in all this method of projecting did meet with some success, though it of course could not predict injury, rampant infighting (Knights), an incredibly unlikely and unsustainable and wildly improbable win streak (Panthers) and of course whatever that was (Dragons).
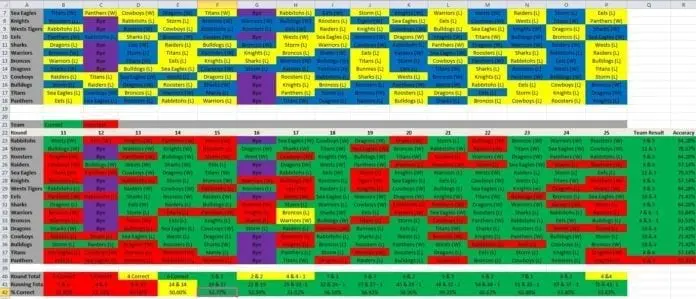
Final result: 62.83% Success rate in predicting the outcome of every game.
Expected ladder (based on the first 10 rounds)
Extrapolating out each teams win / loss to a full season shows the following Final Ladder.
| Club | Wins | Losses | Byes | Points | |
| 1. | Rabbitohs | 21 | 3 | 1 | 44 |
| 2. | Storm | 19 | 5 | 1 | 40 |
| 3. | Roosters | 19 | 5 | 1 | 40 |
| 4. | Raiders | 14 | 10 | 1 | 30 |
| 5. | Sea Eagles | 14 | 10 | 1 | 30 |
| 6. | Knights | 12 | 12 | 1 | 26 |
| 7. | Wests Tigers | 12 | 12 | 1 | 26 |
| 8. | Eels | 12 | 12 | 1 | 26 |
| 9. | Sharks | 12 | 12 | 1 | 26 |
| 10. | Warriors | 10 | 14 | 1 | 22 |
| 11. | Broncos | 10 | 14 | 1 | 22 |
| 12. | Dragons | 10 | 14 | 1 | 22 |
| 13. | Cowboys | 10 | 14 | 1 | 22 |
| 14. | Bulldogs | 7 | 17 | 1 | 16 |
| 15. | Titans | 5 | 19 | 1 | 12 |
| 16. | Panthers | 5 | 19 | 1 | 12 |
Stats Projected ladder
Using the formula to project the results of each game and thus the ladder
| Club | Wins | Losses | Points | Rank Change from Expected Ladder | |
| 1. | Rabbitohs | 22 | 2 | 46 | Unchanged |
| 2. | Roosters | 20 | 4 | 42 | Up one spot |
| 3. | Storm | 19 | 5 | 40 | Down one spot |
| 4. | Sea Eagles | 15 | 9 | 32 | Up one spot |
| 5. | Raiders | 13 | 11 | 28 | Down one spot |
| 6. | Parramatta | 13 | 11 | 28 | Up two spots |
| 7. | Knights | 12 | 12 | 26 | Down one spot |
| 8. | Sharks | 12 | 12 | 26 | Up one spot |
| 9. | Wests Tigers | 10 | 14 | 22 | Down two spots |
| 10. | Broncos | 9 | 15 | 20 | Up one spot |
| 11. | Warriors | 9 | 15 | 20 | Down one Spot |
| 12. | Dragons | 9 | 15 | 20 | Unchanged |
| 13. | Bulldogs | 8 | 16 | 18 | Up one spot |
| 14. | Cowboys | 8 | 16 | 18 | Down one spot |
| 15. | Titans | 6 | 18 | 14 | Unchanged |
| 16. | Panthers | 3 | 21 | 8 | Unchanged |
Actual end of season ladder
Final 2019 NRL Ladder
| Club | Wins | Losses | Points | Stat Project LDR Change | Expected LDR Change | |
| 1. | Storm | 20 | 4 | 42 | Up 2 spots | Up 1 spot |
| 2. | Roosters | 17 | 7 | 36 | Unchanged | Up 1 spot |
| 3. | Rabbitohs | 16 | 8 | 34 | Down 2 spots | Down 2 spots |
| 4. | Raiders | 15 | 9 | 32 | Up 1 spot | Unchanged |
| 5. | Eels | 14 | 10 | 30 | Up 1 spot | Up 3 spots |
| 6. | Sea Eagles | 14 | 10 | 30 | Up 1 spot | Unchanged |
| 7. | Sharks | 12 | 12 | 26 | Up 1 spot | Up 2 spots |
| 8. | Broncos | 11 | 12 | 25 | Up 2 spots | Up 3 spots |
| 9. | Wests Tigers | 11 | 13 | 24 | Unchanged | Down 2 spots |
| 10. | Panthers | 11 | 13 | 24 | Up 6 spots | Up 6 spots |
| 11. | Knights | 10 | 14 | 22 | Down 4 spots | Down 5 spots |
| 12. | Bulldogs | 10 | 14 | 20 | Up 1 spot | Up 2 spots |
| 13. | Warriors | 9 | 14 | 21 | Down 2 spots | Down 3 spots |
| 14. | Cowboys | 9 | 15 | 20 | Unchanged | Down 1 spot |
| 15. | Dragons | 8 | 16 | 18 | Down 3 spots | Down 3 spots |
| 16. | Titans | 4 | 120 | 10 | Down 1 spot | Down 1 spot |
- Note: There was one draw in 2019 (Warriors vs. Broncos)
Average Ladder Position Variance
| Stat Projected Ladder | Expected Ladder |
| 1.68 | 2.06 |
Success!!!! The stat projected ladder was on average out by 1.68 spots on the ladder for each team while the expected ladder was out by 2.06 positions! The stat projected ladder was in fact a more accurate means of predicting the final ladder than merely extrapolating the Rd. 10 ladder. Was it worth all the work? Debatable. Was it as accurate as I would have liked? Of course not, but that is half the fun and next years installment will feature tweaks to the formula to try to improve on the 2019 Variance.
Final result: The stats projected Ladder was more accurate in predicting each teams final ladder position.
Correct Predictions
| Category | Stat Projected Ladder | Expected Ladder |
| Ladder position | 2 | 2 |
| Points Total | 2 | 2 |
| Wins | 2 | 2 |
| Losses | 2 | 2 |
Dead even with the correct predictions using the two methods. While the per ladder position result using the stat projected was better than the predicted ladder, each was just as effective at accurately predicting a specific result. Interesting.
Grand Finalists
The projected Roosters v Raiders Grand Final is still alive and for those who saw their week one finals efforts, looks a very real possibility. We shall check back on this in 2 weeks time.
Final Result: To be determined
Final thoughts
show filter2 big movers in Penrith and Newcastle defied their projections for very contrasting reasons. While the Panthers got hot and went on a completely unexpected winning streak, the wheels completely fell off for the Novacastrians, resulting in the highly contentious departure of their coach. We know we can’t use the stats to predict everything and these two teams absolutely exemplified this in 2019.
Penrith’s win streak came from out of nowhere after a disastrous start to the season while the alleged infighting and back room moves at the Knights can be largely attributed to their downfall, but we cannot quantify it. While we typically know a coach losing the team will have a negative impact on the side, this exercise has shown there is no measure for it nor any way to predict it.
The stats can give us tremendous insight into our great game, but at the of the day there will always be the human element to it, and as this exercise has demonstrated we cannot put a number on that…… yet.
Thanks for reading as always and good luck to those with teams still in the hunt.
Trust in the Data!


The photo of Walker flipping out was the First thing that was brought to my attention for this story of that angry ant with a chip on his part indigenous shoulders. What a tossel. He only brings a bad taste to the proud Indigenous people with his carrying on like a fool.
The only stats that matters now is that in the past 10 games, the Sydney Roosters have the best attack and most of all the best defence record of the remaining teams.
The other stat that only maters is when JWH did not play this year in 6 games. Sydney still won 4 of those 6 games for a 66% win rate.
Not the 40% rot that everyone is going on about over so many years. Different teams for different years. This team covers well for when JWH is not playing.
62.83% prediction rate nice. Beats my 59% for the year. Well your on track with Roosters v Raiders GF. That’s what ive gone for anyway.
Excellent reading Matthew.
I was wrong about the roosters finishing as high as they did but had I known the influence the MRC and judiciary played beforehand I might have been closer to the mark not to mention the diabolical errors in favor of the roosters by Ashley Klein.
Shame the NRL didnt step in before the 1st semi where Hargreaves , Cordner and Tetevano would have been correctly suspended and Sam Burgess rightly playing.
Good to see common sense finally with Hargreaves and Klein dealt with accordingly.
Goodbye roosters.
Hahahaha time to move on Stephanie.
The dud chody walk-about will be exposed again this week. What sort of player debuts at 26?
Very clever Matthew, well done
A late blooming Dud debuts at 26. I was actually at that game he played against the Chooks at the Footy Stadium rnd 1 2016. He scored a try but showed potential back then that he was always going to be a ball hogging Dud.
Hoping the garden gnome Joke Friend is called up this week.
Now that the ruck wrestle and dummy half forward passes have finally been addressed which the roosters a premiership on a platter last year there’s nothing left in Friend’s worth.
Potato head Wobbo lacks the character strength to omit him if Joke is fit.
Venerials isn’t much himself but a step up on Joke.
Regardless of who Wobbo selects, the chickens will exit Sat night at the hands of a better side that will meet Souths in the GF.